Ten-Year Trend
On October 16, the official report on visa grants for the 2023-24 financial year was released, revealing the outcomes of all Australian migration visa categories over the past year.
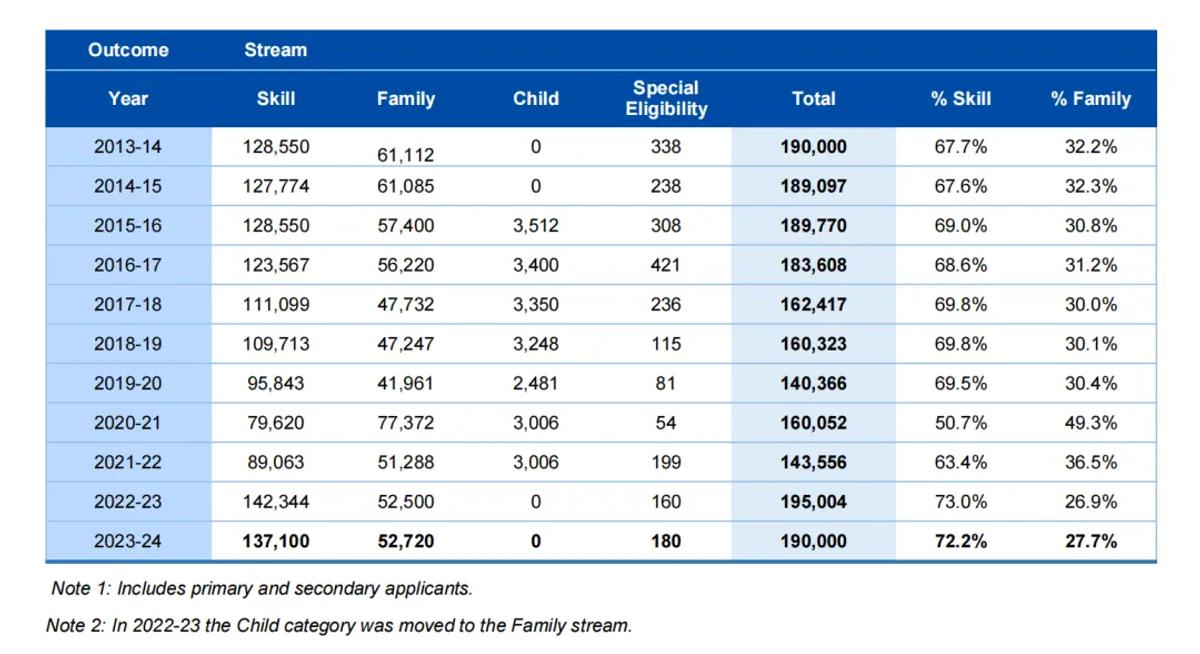
Annual migration numbers range from 140,000 to 200,000, with a skilled-to-family migration ratio of 7:3. In recent years, the proportion of skilled migration has been increasing, now exceeding 70%.
State Migration Trends
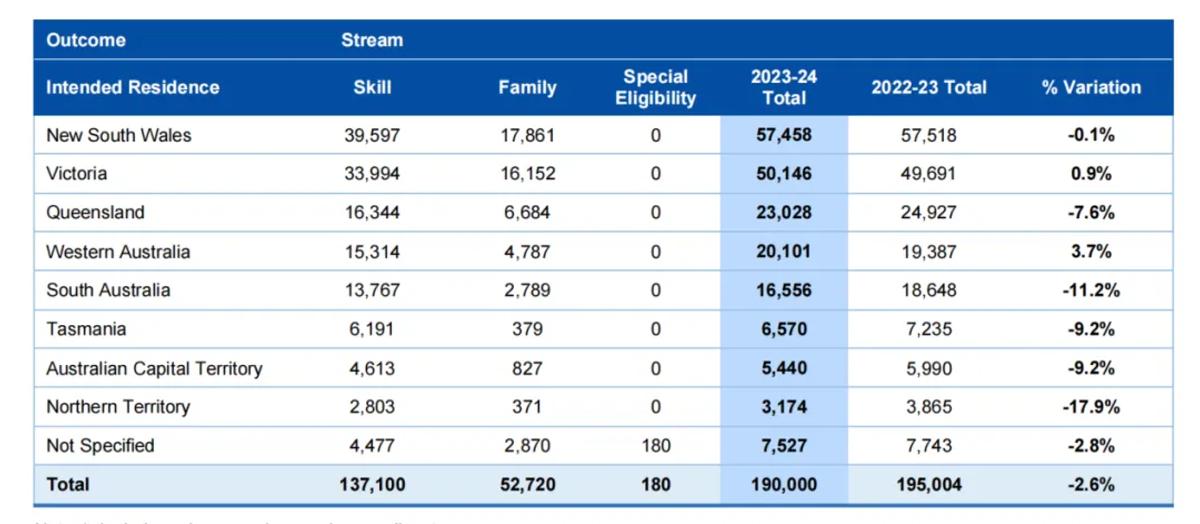
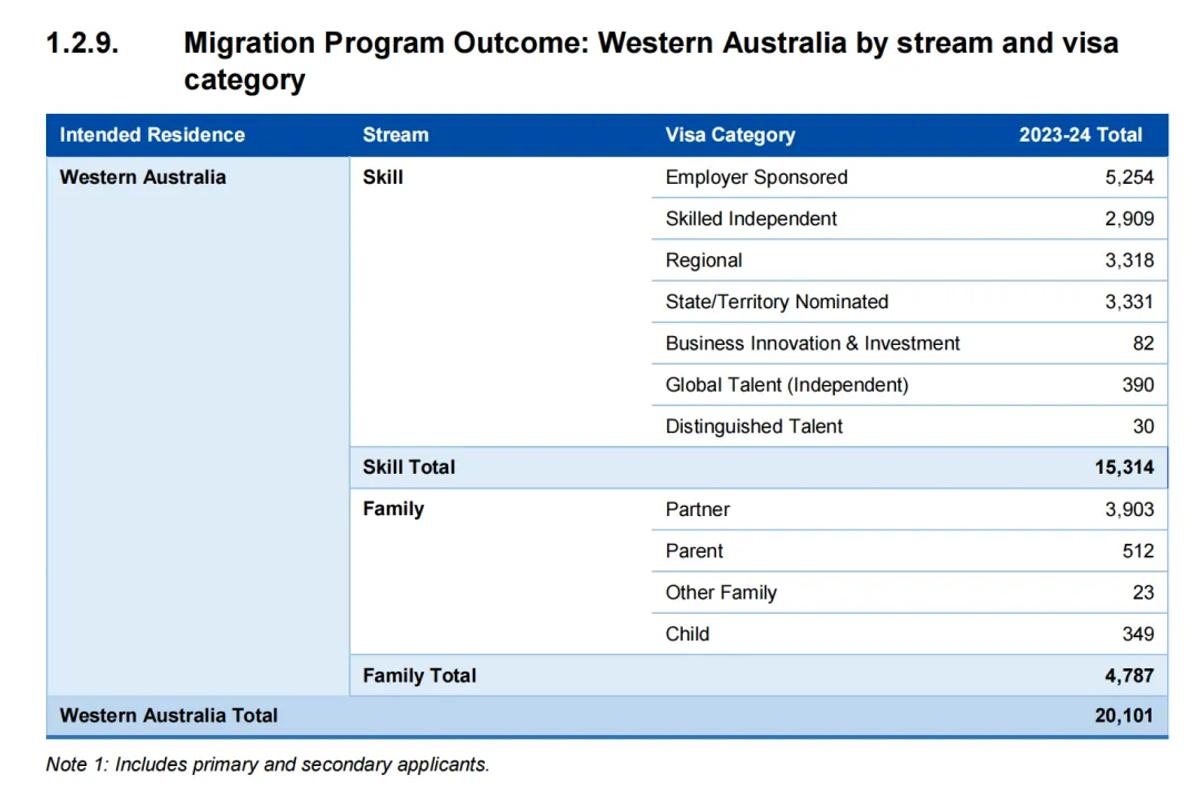
The total migration number in 2023-24 was 5,000 fewer than 2022-23. However, Western Australia (WA) saw a 3.7% increase and Victoria (VIC) saw a 0.9% increase in migration numbers. The WA government has been actively promoting migration, launching the exclusive 5,000-quota WA DAMA for 2024-25. South Australia and the Northern Territory saw quota reductions of over 10%.
State-by-State Visa Allocation
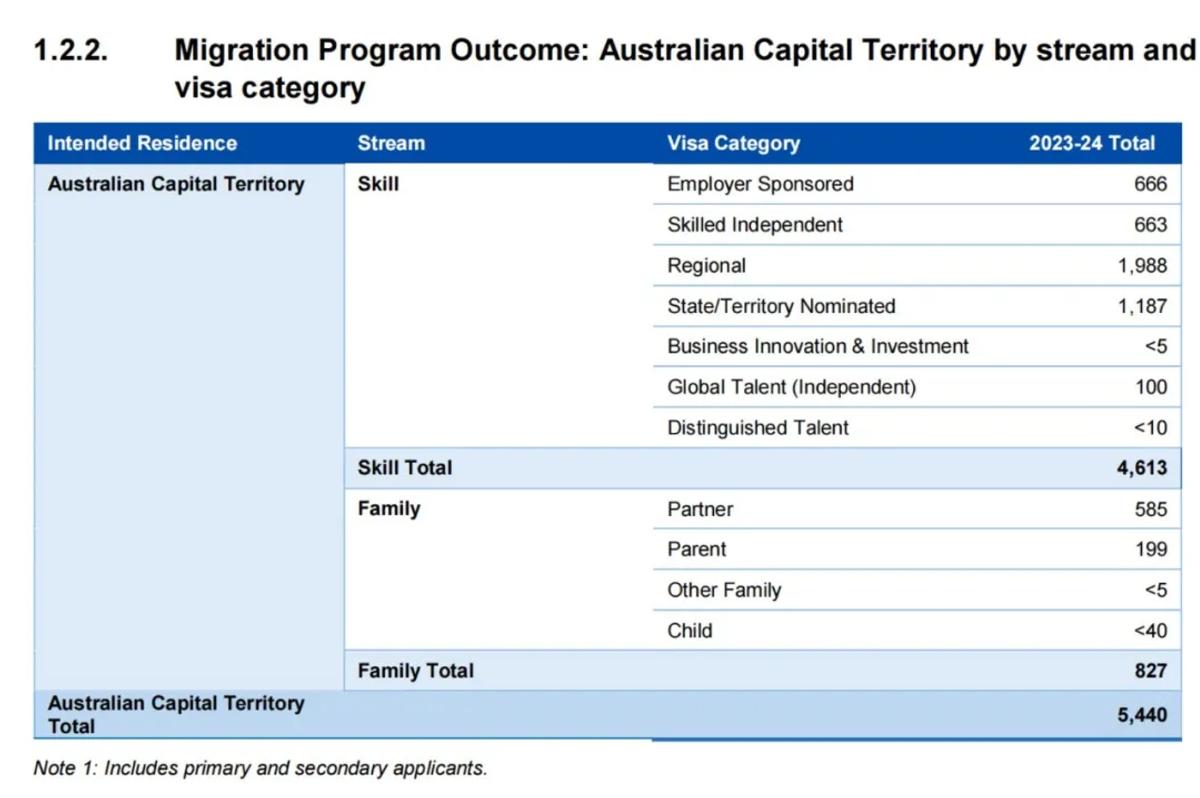
ACT: Regional visas and state nominations are the most common migration pathways.
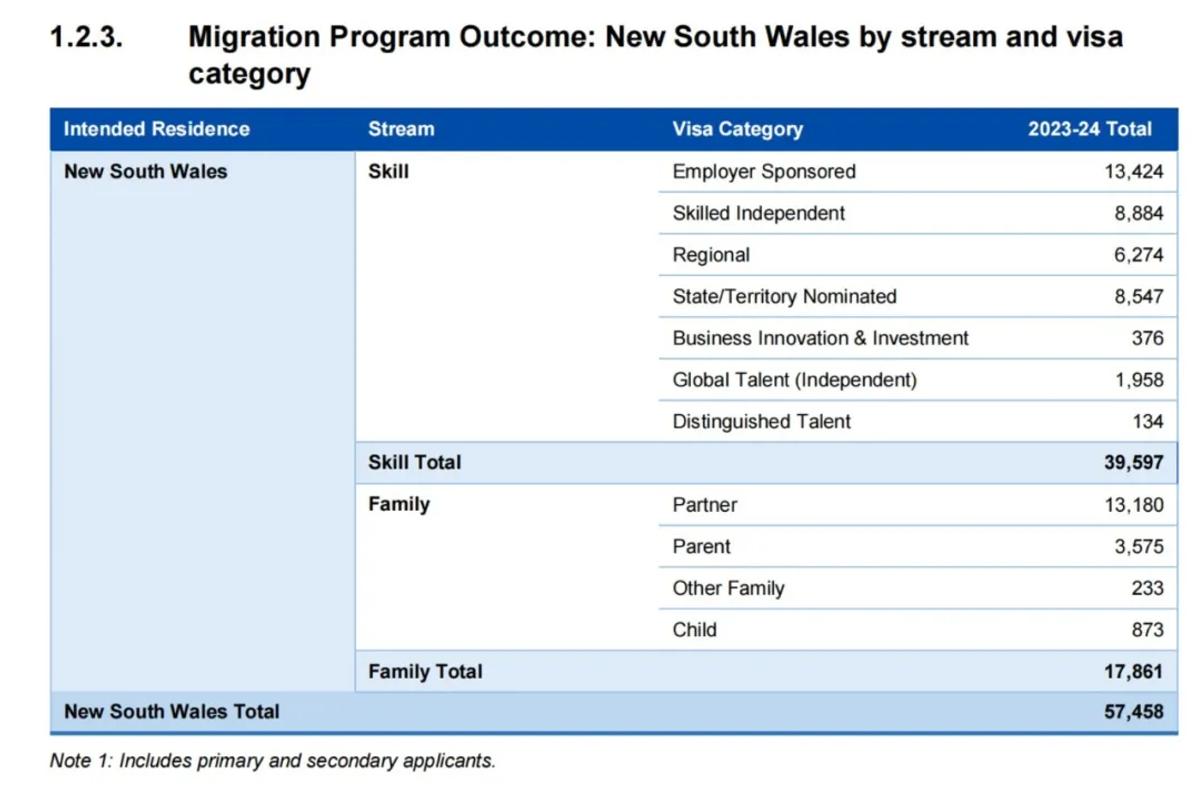
NSW: A popular migration destination with many employers and positions. Over 36% of employer-sponsored visa intentions are for NSW.
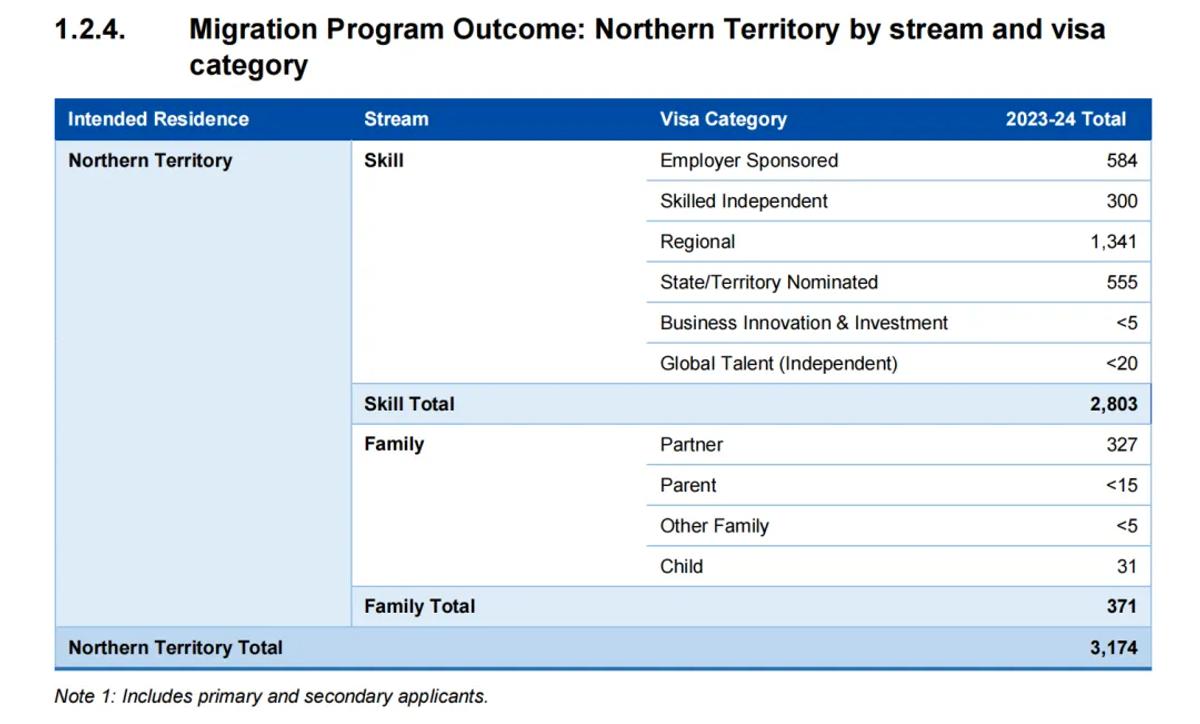
NT: Relatively remote, with a higher proportion of 494/491 visas.
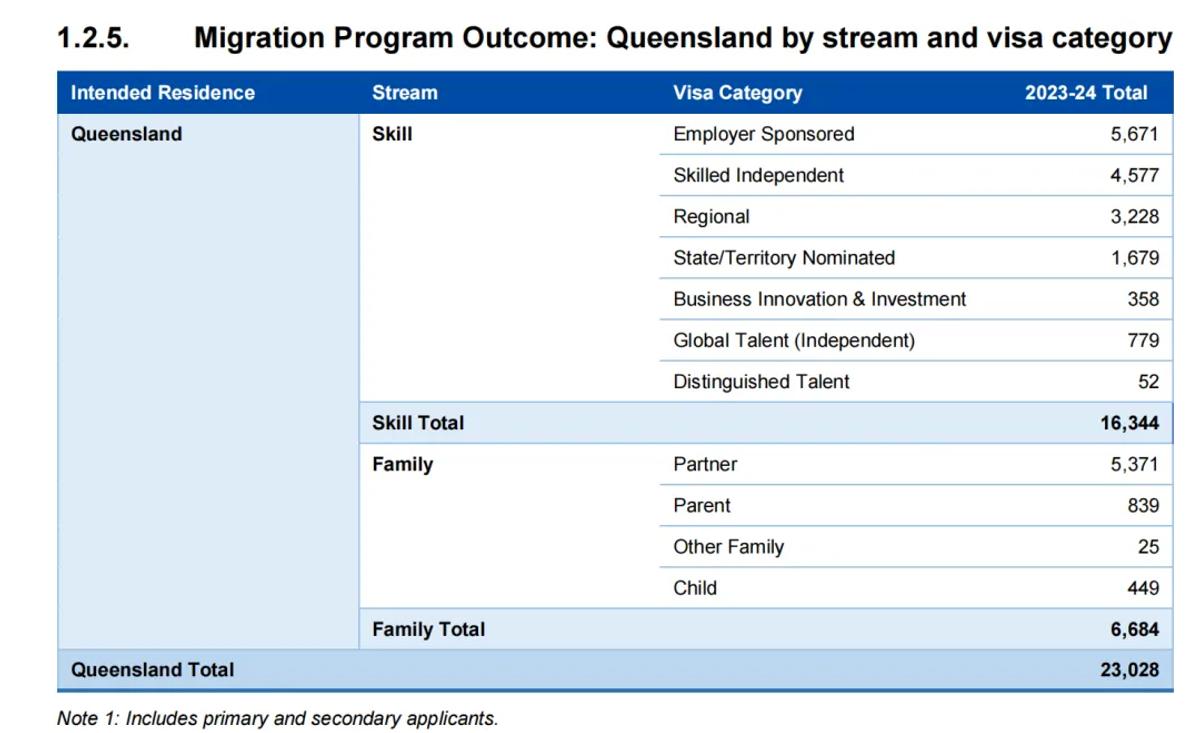
QLD: Less shortage of workers; fewer state-sponsored and 494 visas issued, but employer-sponsored visas perform relatively well.
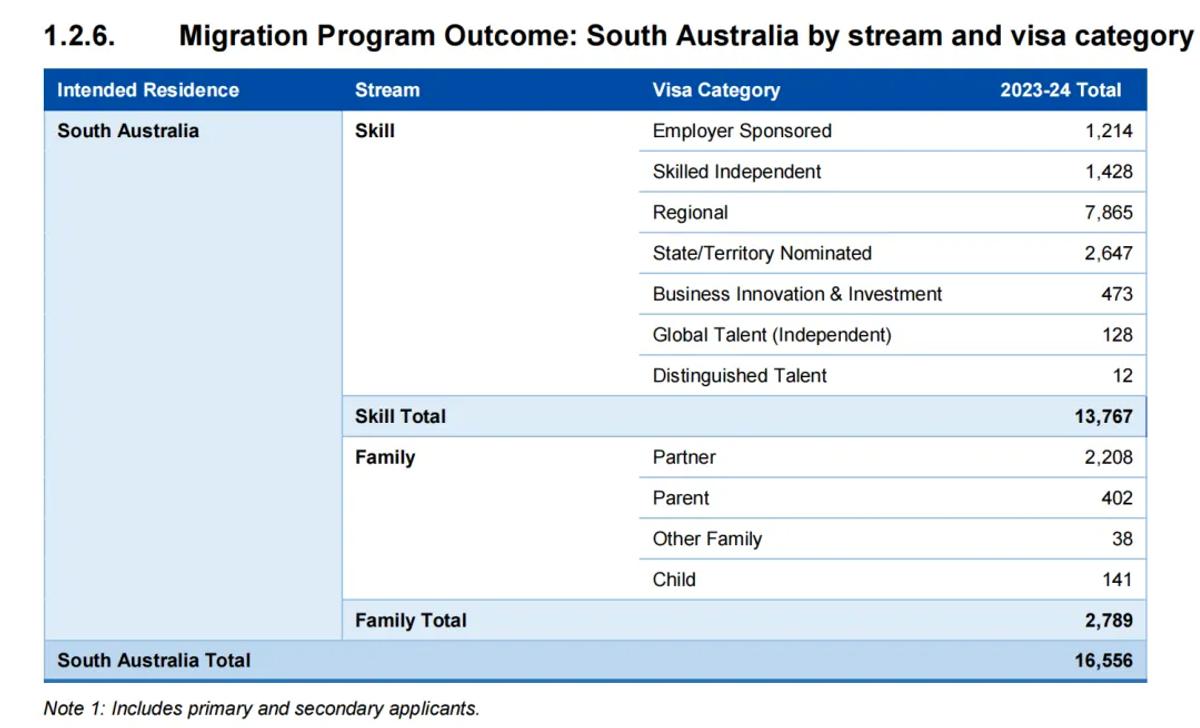
SA: More willing to issue 494/491 visas. Last year's Regional primary applicant quota was 2,300, but 7,865 visas were granted.
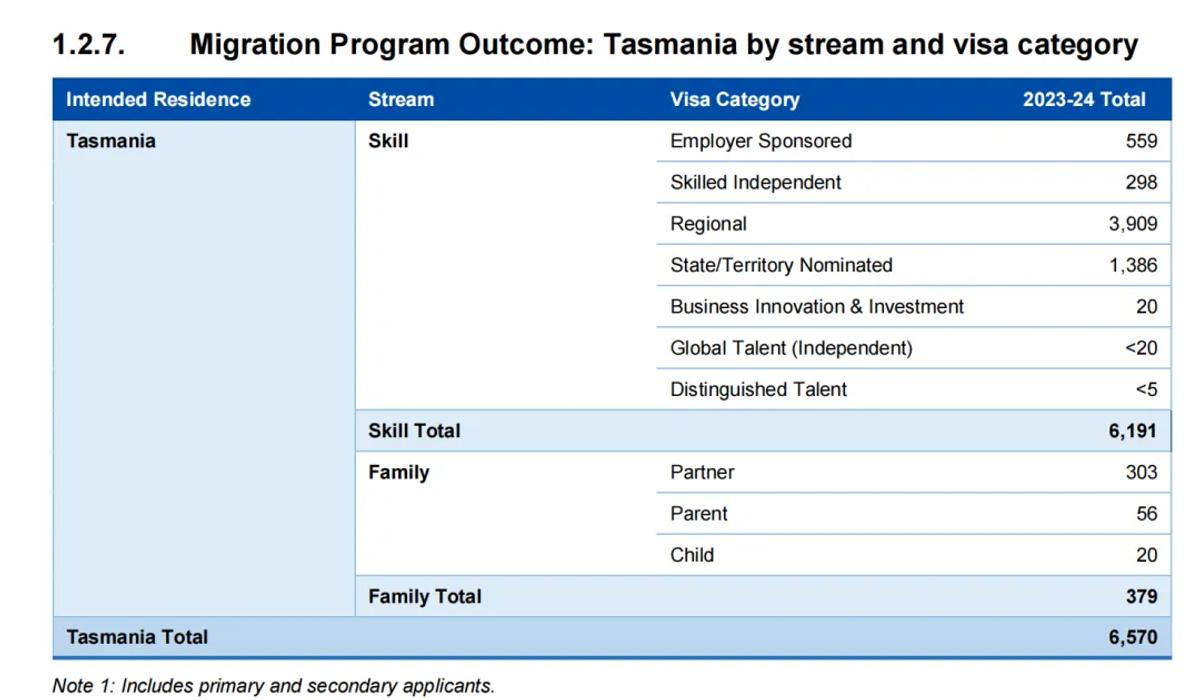
TAS: Also willing to issue 494/491 visas. Regional primary applicant quota was 1,200, with 3,900 visas granted.
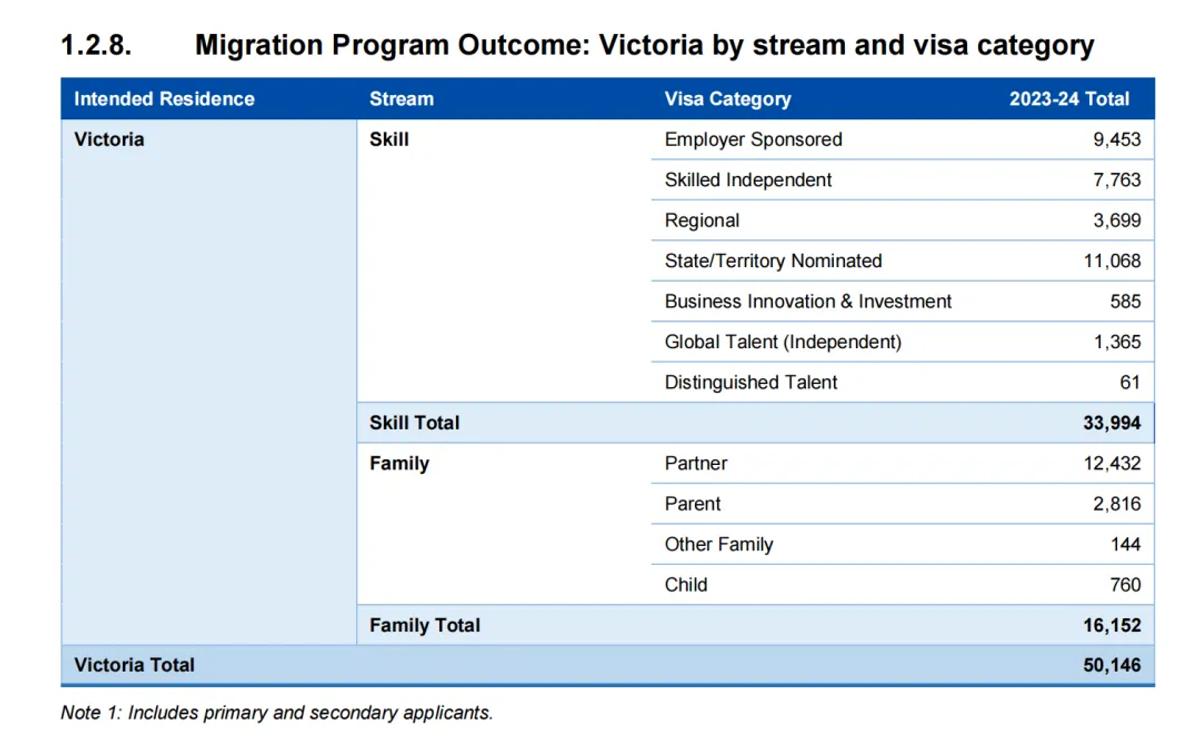
VIC: A popular migration destination, issuing 36% of all state nominations.
WA: Prefers employer-sponsored visas over state nominations and regional visas; 15% of employer-sponsored visas are issued from WA.
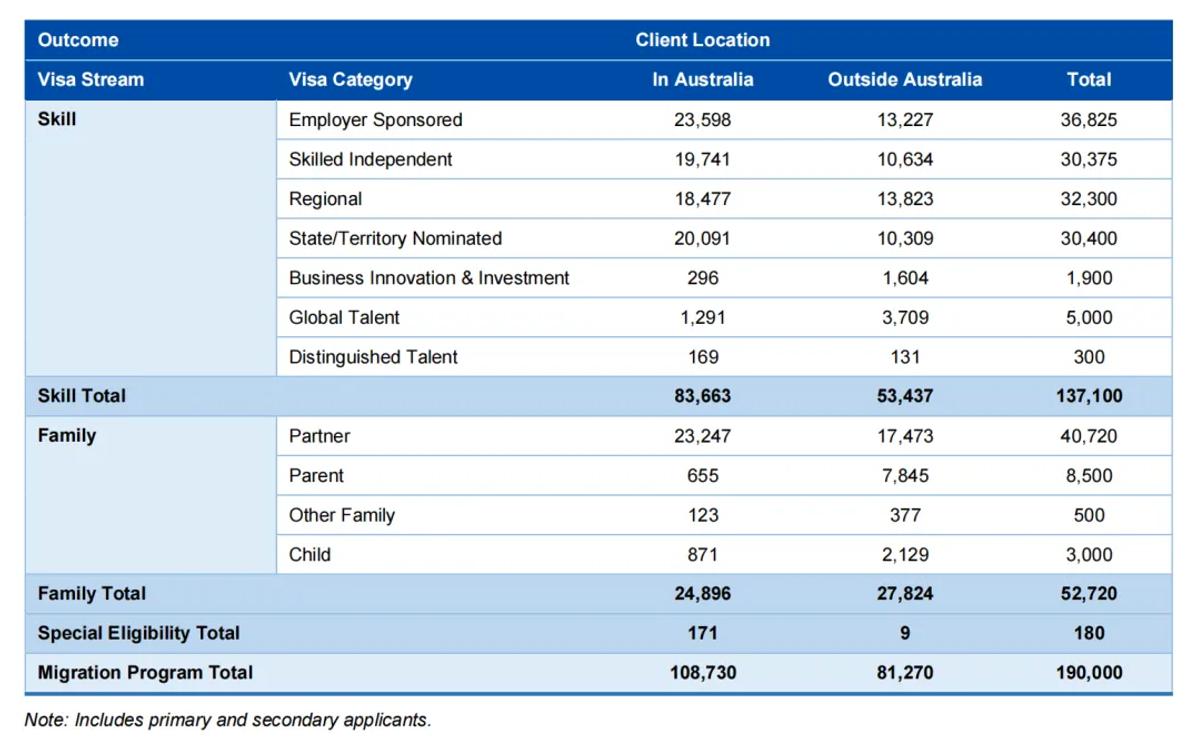
Onshore/Offshore Applicant Distribution
For employer-sponsored 186, independent skilled 189, and state-nominated 190 visas, the onshore/offshore ratio is approximately 2:1. For regional 494/491 visas, the ratio is 1.3:1. For investment migration 188, the ratio is 1:5.
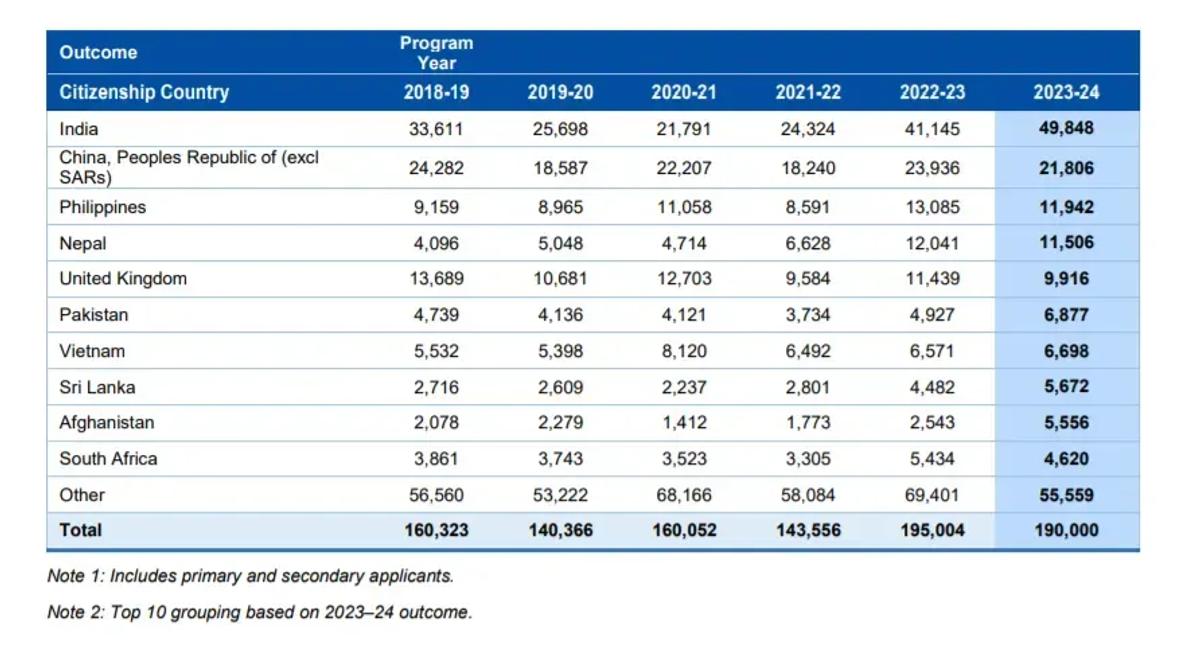
Country of Origin
India continues to rapidly increase its share of skilled migration. Last year, the top countries for visa grants were India (49,848), followed by China (21,806). Within skilled migration, China received 11,520 grants; within family migration, China received 10,284 grants.
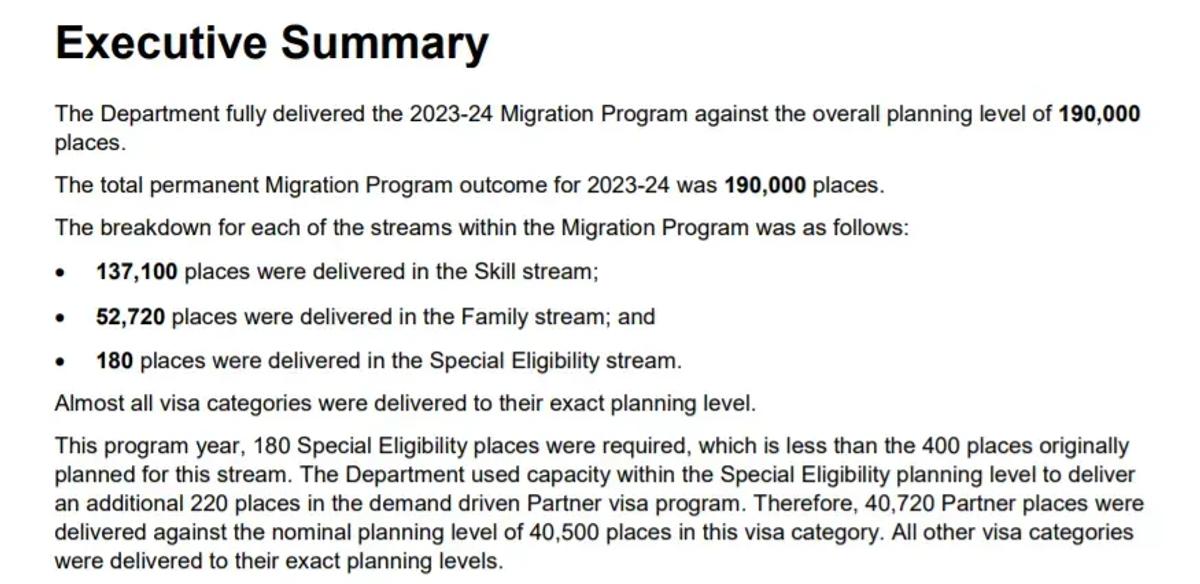
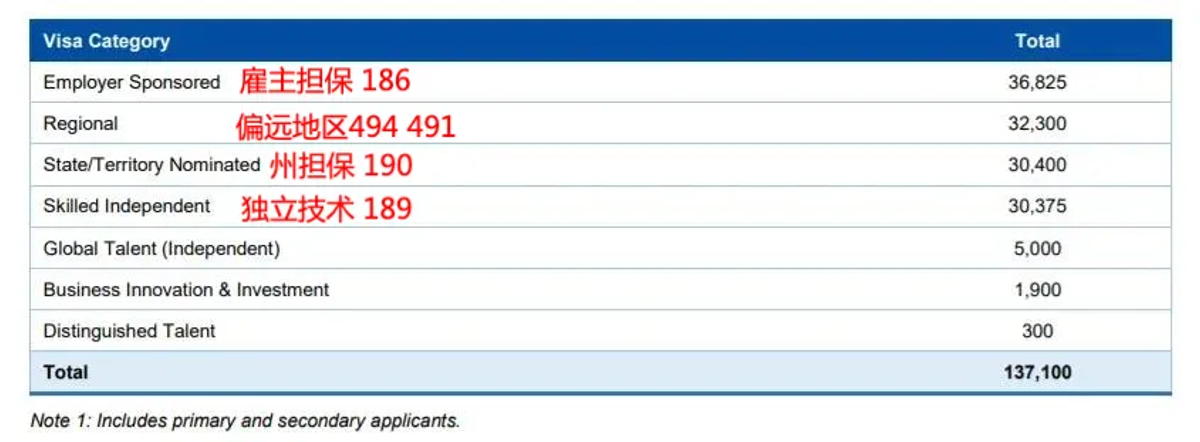
The 2023-24 financial year migration ceiling was 190,000, with skilled migration accounting for 137,100 places.
Skilled Migration Visa Grant Breakdown
Employer-sponsored: 36,825
Regional nomination: 32,300
State/territory nomination: 30,400
Independent skilled: 30,375
Global Talent (Independent): 5,000
Business Innovation and Investment: 1,900
Distinguished Talent: 300
Total: 137,100
All skilled migration quotas were fully utilized last year.
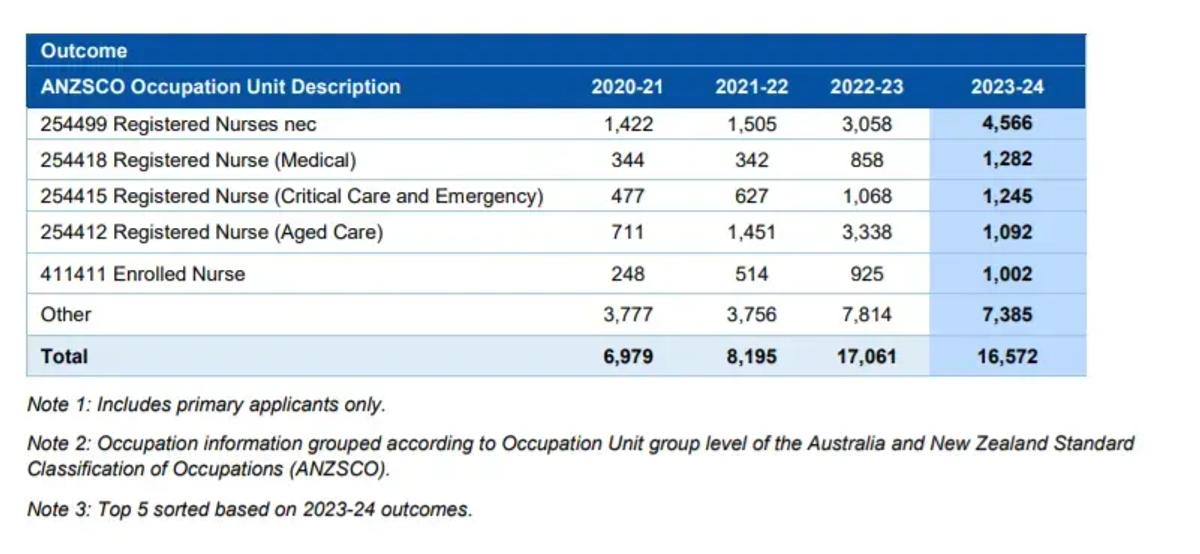
Nursing and Teaching Occupations
The Department highlighted teachers and nursing professionals across all skilled pathways, comparing four years of visa grant data.
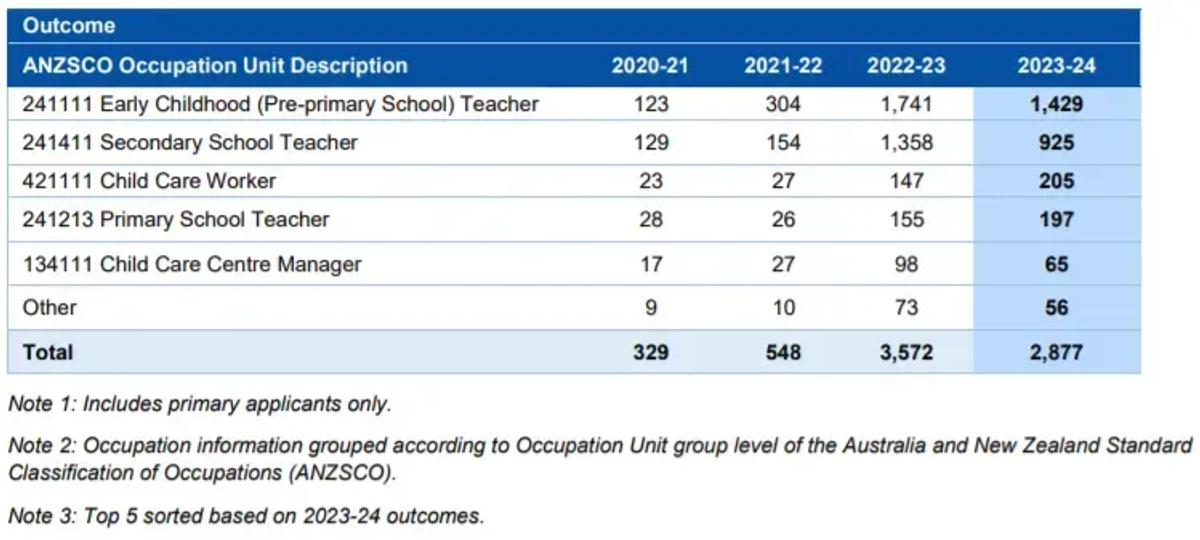
Nursing occupations showed significant growth across all categories, with total nursing grants reaching 16,572 in 2023-24. Teaching occupations also saw explosive growth, with early childhood teachers growing from 100-300 to over 1,000 grants.
Teaching occupations:
Early childhood teachers grew from 100-300 to over 1,000 grants.
Secondary school teachers grew from just over 100 to around 1,000 grants.
Childcare workers increased from 20+ to 200+ grants.
Primary school teachers increased from 20+ to nearly 200 grants.
Childcare centre managers increased from 10+ to nearly 50 grants.
Nursing and teaching have become popular invitation occupations with increasing grants year by year. Nursing dominates with 16,572 grants in 2023-24, making it the most reliable migration profession.
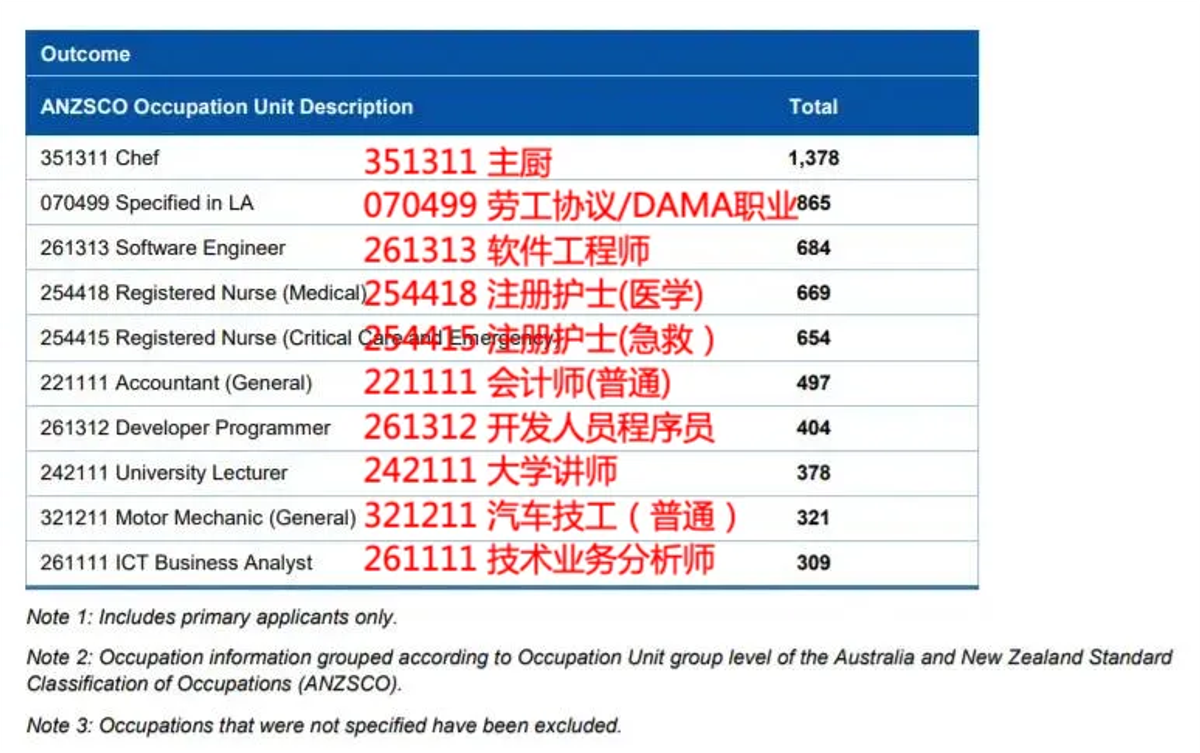
Top 10 Occupations for 186 Visa Grants
Australia's 070499 is a non-standard occupation code covering occupations not on regular skilled occupation lists, including truck drivers under the DAMA program.
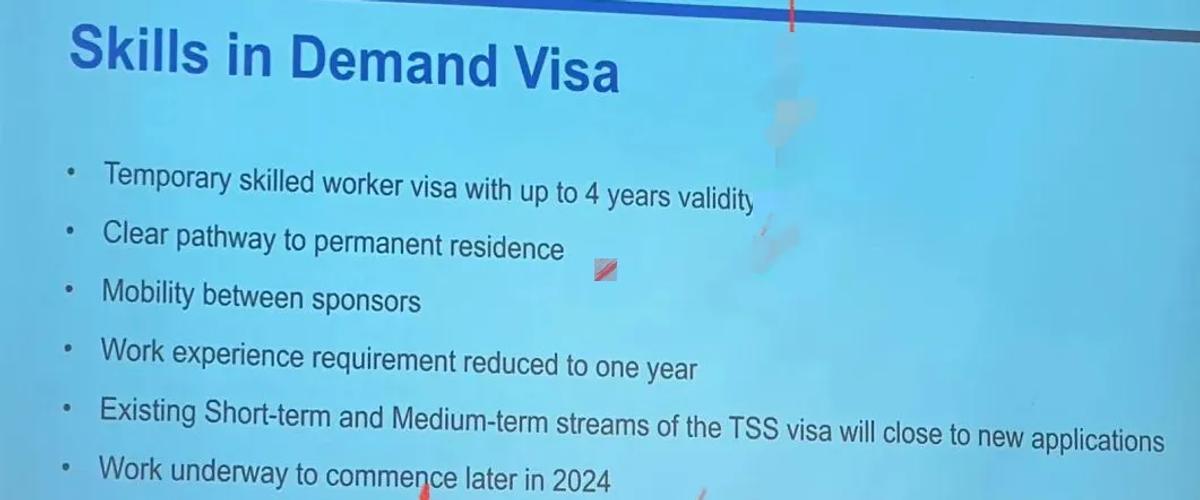
Since late 2023, employer-sponsored visa processing has been elevated to the highest priority. 186 data shows strong performance for chefs, nursing, accounting, and IT. DAMA and Labour Agreement pathways have opened permanent residency routes for applicants not on standard occupation lists. The 482 visa will be reformed into the SID (Skills in Demand) visa in 2025, providing clearer pathways to permanent residency.
Visa Backlog Summary
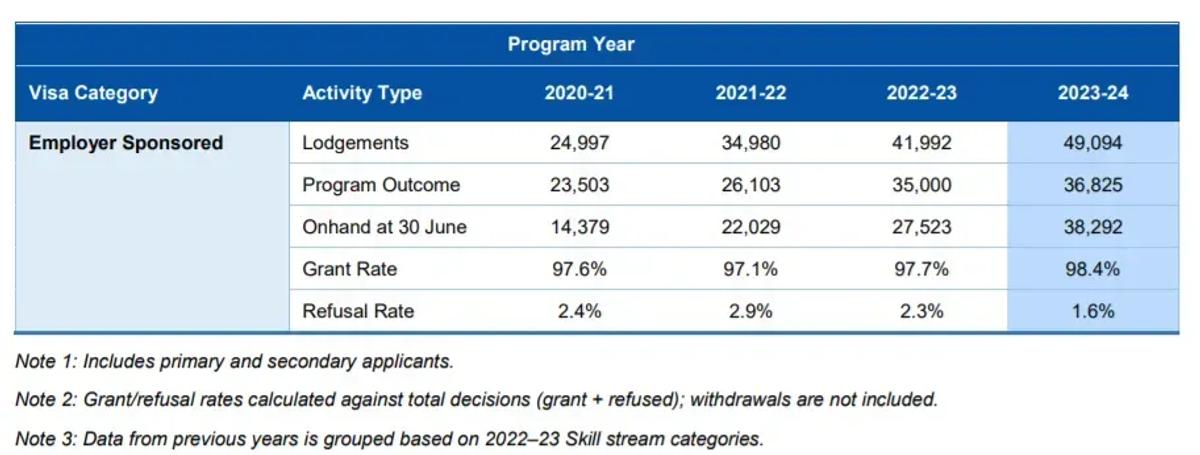
186 Visa: 98.4% Grant Rate
The employer-sponsored category is booming. 186 received nearly 50,000 new applications last year, with all quotas filled and over 38,000 cases remaining in the backlog.
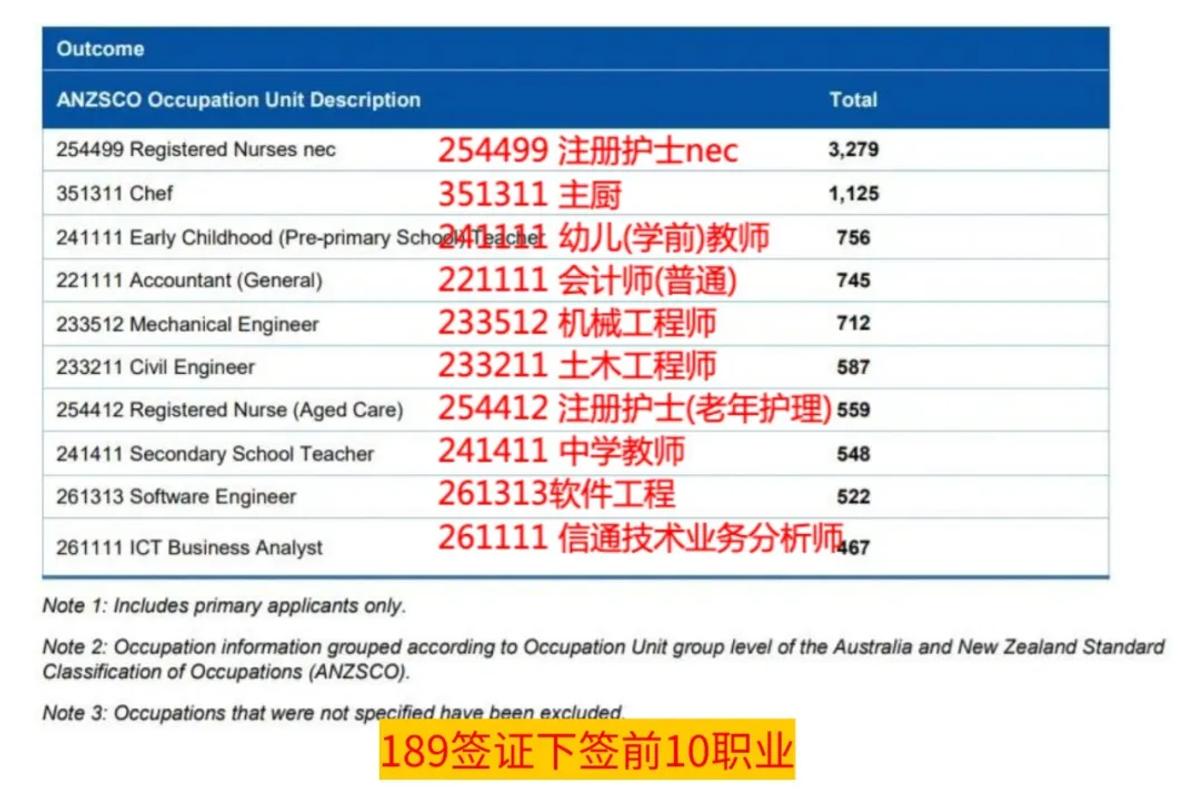
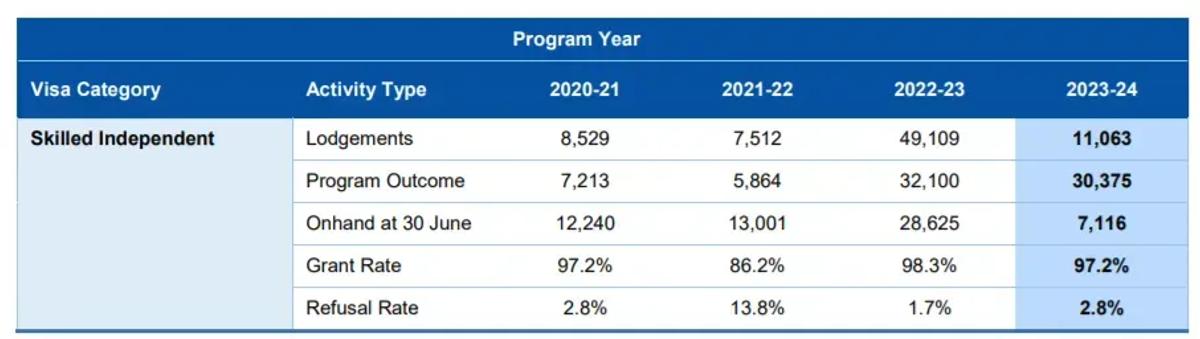
189 Visa: 97.2% Grant Rate
11,063 new applications in 2023-24. All 30,375 quotas were used. Remaining backlog: 7,116. The 2024-25 quota is 16,900.
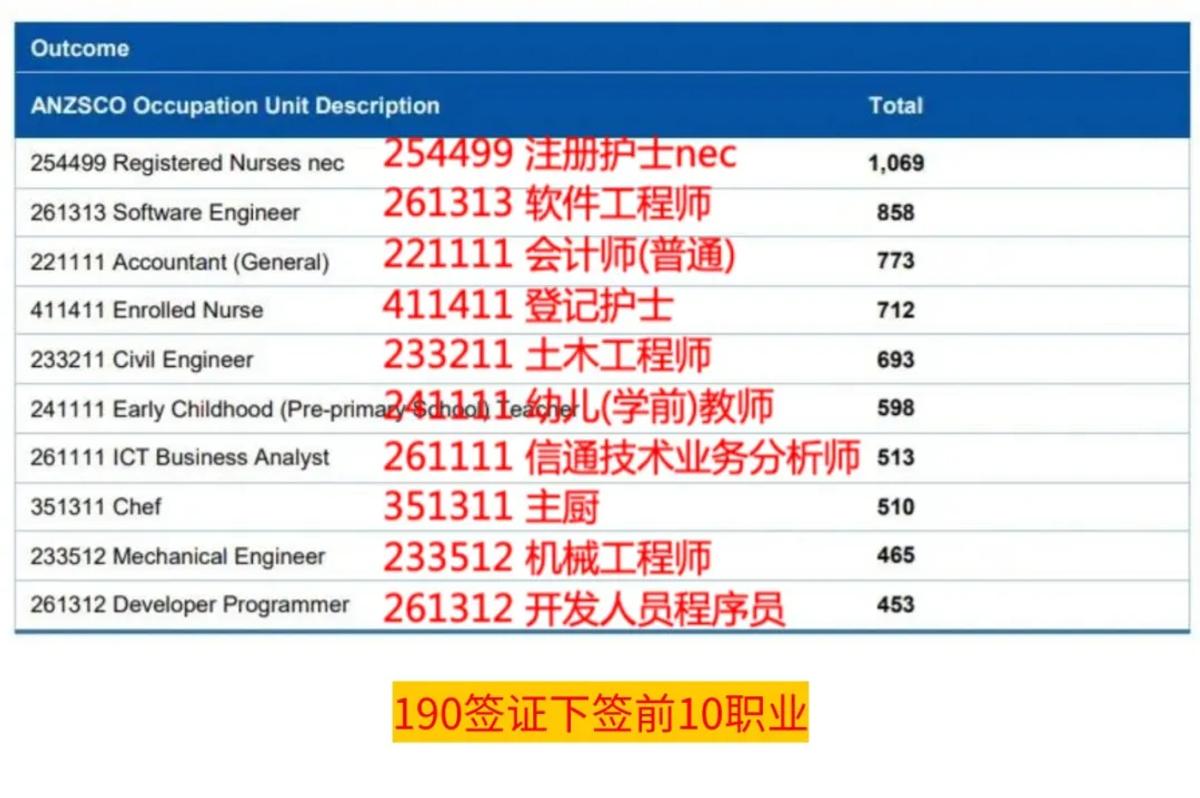
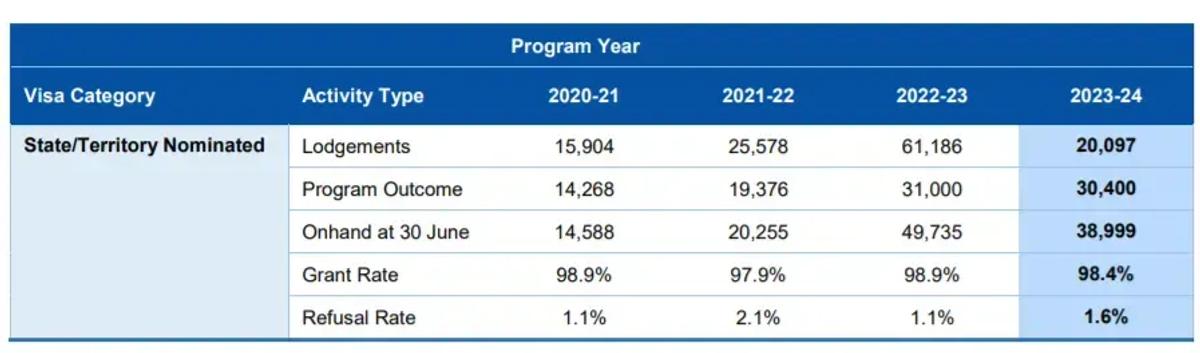
190 Visa: 98.4% Grant Rate
Just over 20,000 new applications. All 30,400 quotas were used. Remaining backlog: 38,999. The 2024-25 quota is 33,000.
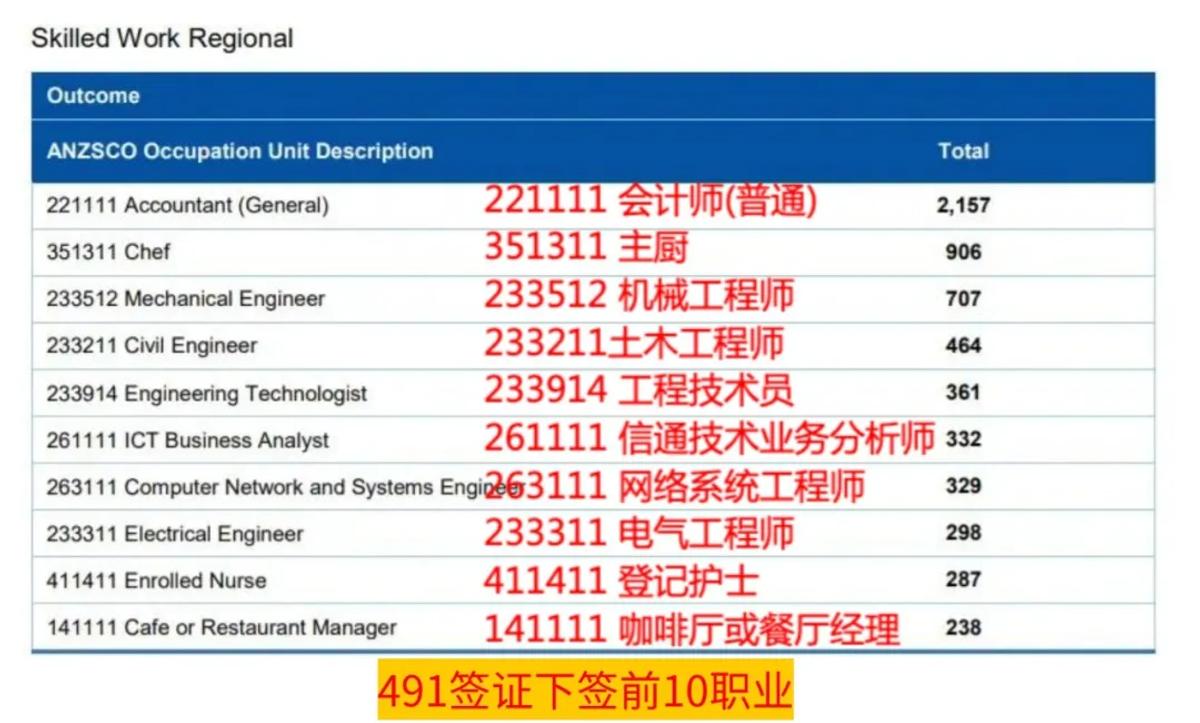
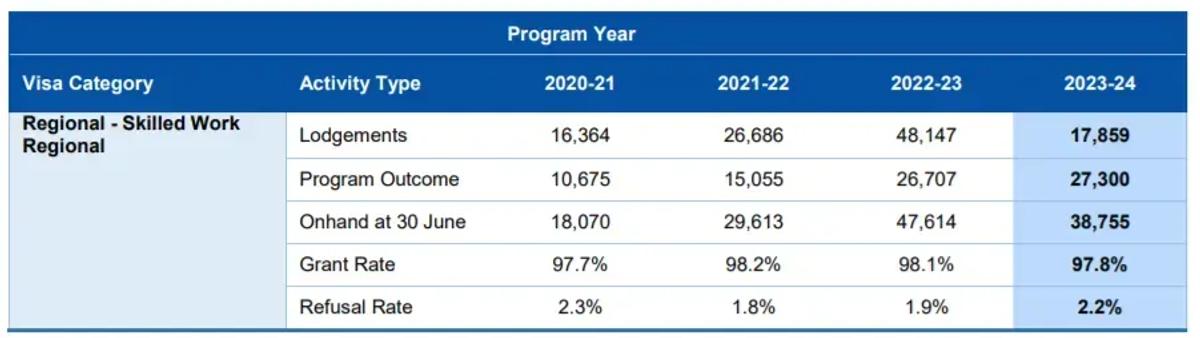
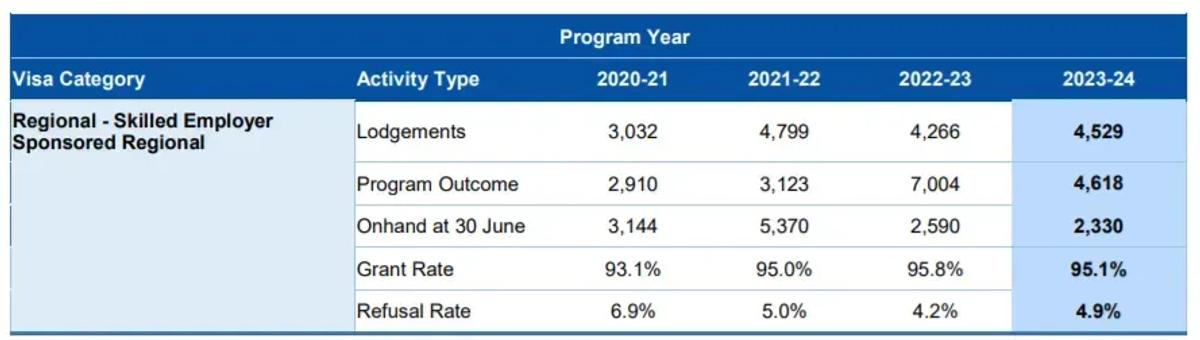
491 Visa: 97.8% Grant Rate
17,859 new applications. 27,300 regional quotas used. Remaining backlog: 38,755.
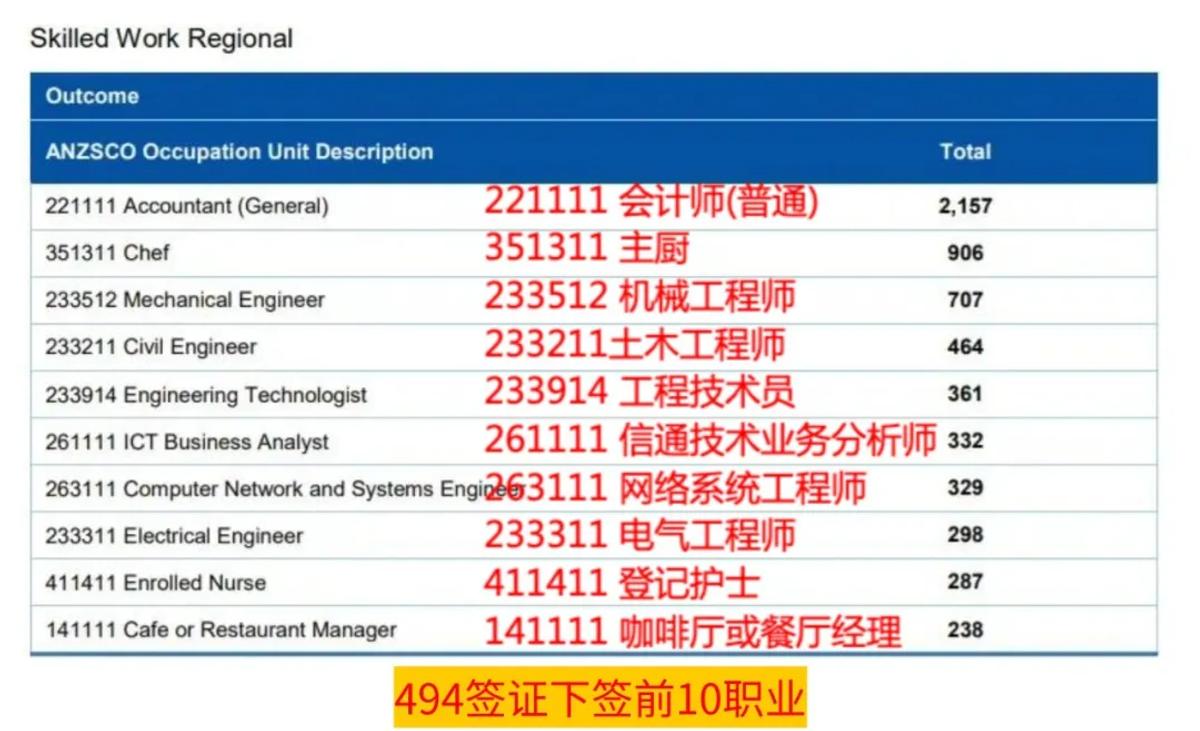
494 Visa: 95.1% Grant Rate
4,529 new applications. 4,618 regional quotas used. Remaining backlog: 2,330.
491 and 494 share the Regional quota: 32,300 for 2023-24 and 33,000 for 2024-25.
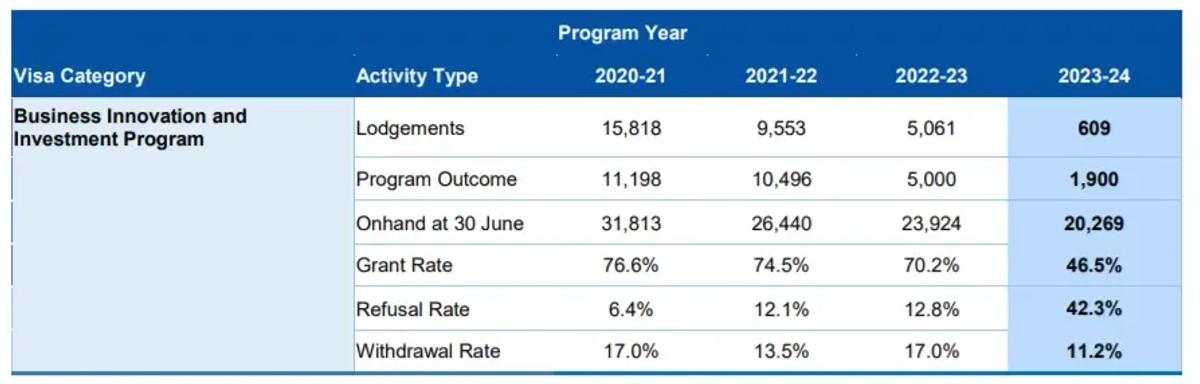
188 Investment Visa: 42.3% Grant Rate
New applications for 188 investment visas were completely halted last year, with only 609 new applications submitted before the cutoff. All 1,900 quotas were allocated, but the backlog exceeds 20,000. The refusal rate is 42.3%.
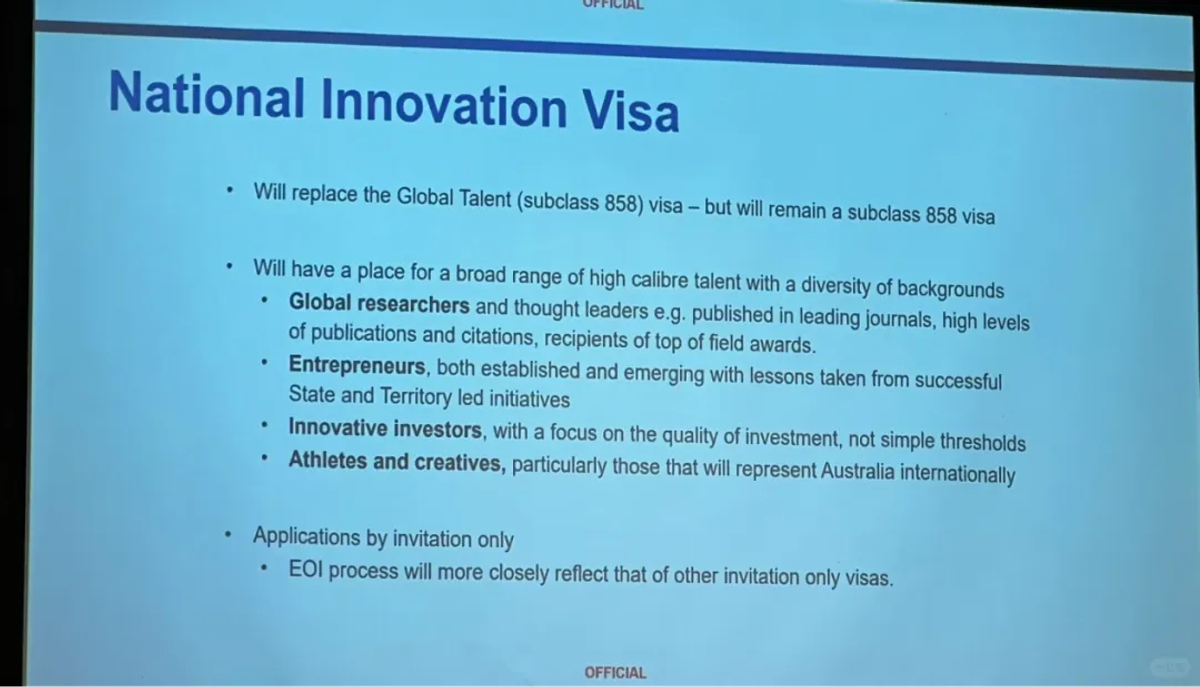
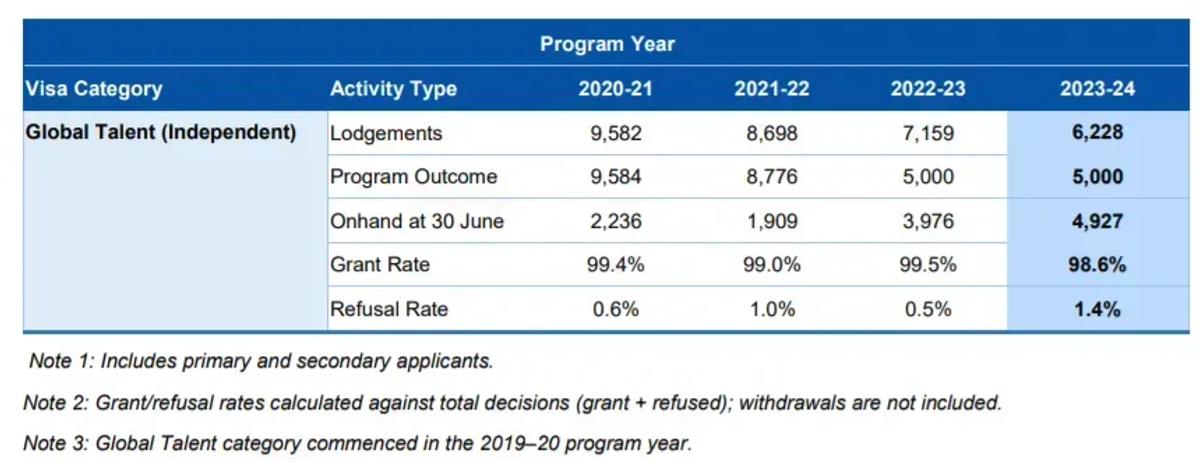
858 GTI Visa: 98.6% Grant Rate
6,228 new applications in 2023-24. All 5,000 quotas were used. Remaining backlog: 4,927. The 2024-25 quota is 4,000. GTI and investment visas are set for reform.
State visa allocation distribution:
Visa category grant comparison:
Skilled migration source country distribution:
Nursing occupation grant trends:
Teaching occupation grant trends:
186 visa occupation distribution:
Visa backlog comparison:
189 visa details:
190 visa details:
491/494 visa details:
188/858 visa details:
Processing priority changes:
Future policy outlook: